
Part Three
- Monitor
Definition:
The medical monitor is an electronic medical device used for medical observation and the physiological data is constantly displayed on the screen of this device.
Species :
Analog observation devices:
Previously, it was used where the device showed an electrocardiogram only and after making specialized adjustments to it, there was a monitor that measures blood pressure and another to measure the pulse.These devices have been widely used and have helped save many lives, but there were many obstacles in their way such as electrical interference, lack of alarms in addition to being expensive.
Digital observation devices:
With the presence of digital signal processing digital signal processing technology, medical monitors have developed significantly.All models have become digital and have the advantage of miniaturization and portability.Its parameters have become the pulse meter, blood oxygen ratio meter, blood pressure, temperature, electrocardiogram.
Observation devices attached to the pacemaker:
Such devices are most often used in the emergency reception unit.This is to save time and effort in transferring the patient from one device to another.
Applications:
1. Measurement of vital signs
2. Electronic Cardiogram
3. Blood pressure is measured by means of a pressure piece that is wrapped around the patient's arm.Normal blood pressure is 120\\80±20\\15
1. Temperature measurement by means of heat converters and the natural temperature is from36. 5 to37. 5
1. Measurement of the percentage of oxygen in the blood.
The most used individuals:
1. - Patients of Critical Care Units.
2. - Patients of dialysis units.
3. - Operating room patients.
4. - The patients of the awakening rooms.
5. - Patients of reception units until they are classified.
6. - Pediatric patients in the neonatal critical care unit.
Normal ECG of the heart
Definition :
An electrocardiogram or (ECG) means an electrocardiogram (electrocardiogram ) or electrocardiograph (electrocardiograph)).
An electrocardiogram is very important in diagnosing many conditions, including :
* Changes in the regular rhythmic heartbeat.
* Helps in diagnosing the cause of chest pain.
* The use of clot solvents in cases of cardiac infarction ( myocardial infarction ) depends on the electrocardiogram.
* Also helps in diagnosing the cause of shortness of breath (breathlessness).
Electrocardiography and how the heart beats .
Definition: electrocardiogram
The contraction of any muscle is accompanied by electric currents called depolarization, i.e. depolarization, and these currents can be recorded by electrodes (electrodes) and these electrodes are connected to the surface of the body, so we can record the contraction of the muscles of the whole body
Therefore, if we want to record the contraction of only the heart muscles clearly, then the person must be at rest and all the other muscles of his body are flat.
Although the heart has 4 chambers, in the electrocardiogram we will see only two chambers because the atria contract together and the ventricles as well.

Electrocardiogram Form (1)
Normal pulse
The normal pulse begins with an electrical signal issued by a specialized neuromuscular generator and electrical regulator, very small in size located in the wall of the right atrium called (sinoatrial node) or sinoatrial node, at a rate of 60-100 beats / electrical signal per minute . This electrical signal spreads very quickly to the atria, which makes them contract to push blood from the atria to the ventricles, and then this electrical signal is transmitted to a receiver, and at the same time it is considered a very small backup generator located between the ventricles and the atria, called (atrioventricular node) or atrioventricular node, which allows the passage of the electrical signal by electrical connections branching from the atrioventricular node to the ventricles In a split second, which makes them contract to push the blood from the ventricles out of the heart, and the right ventricle pushes the non-oxidized blood to the lungs to be oxidized, and the left ventricle pushes the oxidized blood to all parts of the body to benefit from the oxidized blood that returns after oxygen is taken from it to the right part of the heart, and so one cycle of blood is completed.
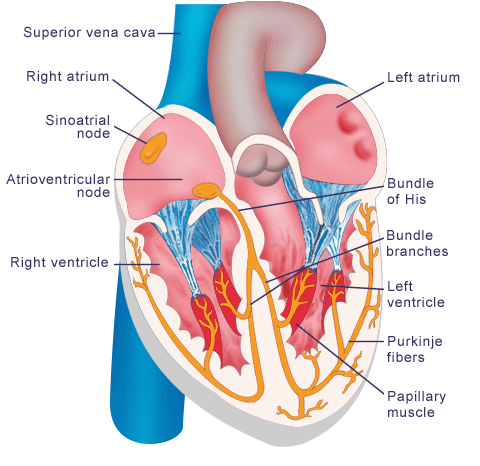
Electrocardiogram Form (2)
Thus, in a normal human, electrical signals originate from the (sinus-atrial node) and at this time the system is called B (heart rhythm) or (sinus rhythm), but in some pathological cases, currents can arise from another source such as (atrioventricular node) and the system is called at this time ( nodal systems) or nodal this may be due to the failure of the sinoatrial node to emit impulses or the presence of an external source-anywhere else in the heart-beats at a higher rate than the basic pacemaker, so in a normal human the electrical signals originate from the (sinoatrial node) and in this Then the system is called B (cardiac rhythms) or (sinus rhythm ), but in some pathological cases, currents can arise from another source such as (atrioventricular node) and the system is called at this time( nodal rhythm) or (nodal rhythm ) or it may originate from any other source such as the muscles of the ventricle itself This may be due to the failure of the atrial sinus node to emit a pulse or the presence of an external source - elsewhere in the heart - beating at a higher rate than the primary pacemaker and taking its place.
ECG images ( leads)
Each electrode connected to the body is considered a camera and we place 10 electrodes on the human body, one on each arm and each leg and at six points on the chest, and therefore we get 10 electrodes (cameras ) from different sides, each camera produces a different image for us from the other camera because each one captures the view of the heart from a different angle, but it is The same view, like a football match, we find that there are more than one camera on the field and each one captures a certain view from a certain angle, but it is the same match .
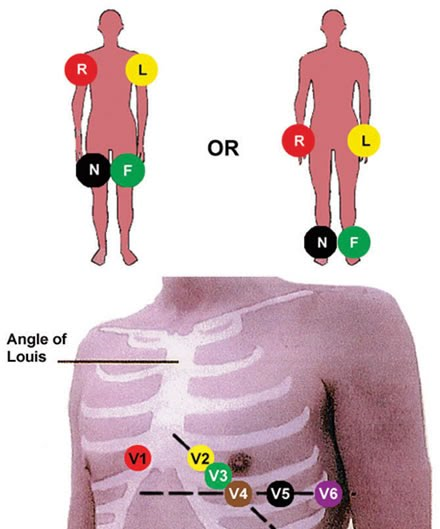
Form (3)
And the EKG produces 12 images for us :
The six electrodes( cameras) on the chest produce US 6 different images (leads) and are called V1,V2,V3, V4, V5,V6
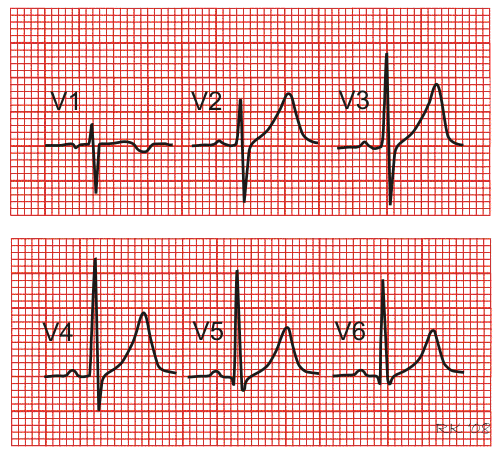
Shape (4)
The places of the electrodes on the chest are as follows :
* V1: in the space number 4, which is between the ribs on the right . 4th intercostal space Rt
V2: in the space No. 4 between the ribs on the left Lt.4 th intercostal space
* V3: at the point between V2 & V1
V4: at the apex of the heart APEX
V5: at the same level as the apex of the heart at the anterior axillary line anterior axial line
V6: at the same level as the apex of the heart at the mid-axillary line
Places of links:
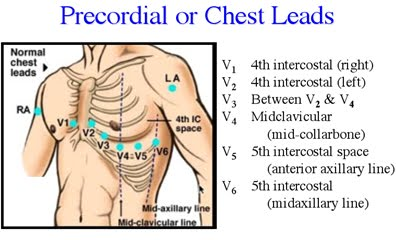
Shape (5)
As for the electrodes on the limbs, each one produces an image for us, except for the one on the left leg, they are only for ground conduction and do not interfere with the drawing
· The right hand is called: aVR
* Left hand: aVL
* Right foot: aVF
The remaining three images are the fusion of each of the two images resulting from the electrodes located at the ends
Image fusion:
* The right hand with the left hand produces for us an image called: (lead I).
• The right hand with the foot is called: (lead II).
* The left hand with the foot is called: (lead III).
And since these images are a fusion of more than one image, they are therefore enlarged (augmented) and in order for the resulting images to be all equal, the device enlarges the other images coming from the parties
( aVR , aVL, aVF) .
* Since the letter (V) means the word (Vector), that is, the vector camera electrode)).
• (a) is (augmented) i.e. magnified as we have explained.
• (R) (Right arm) .
• (L) (Left arm).
• (F ) Foot) ).
The images are arranged as follows ( from North to right, of course ):
• Lead I, lead II, lead III, aVR, aVL , aVF, V1,V2,V3,V4,V5,V6))-
The form of an electrocardiogram
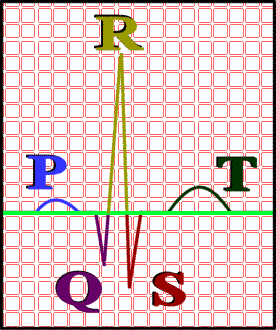
The muscles of the atria are smaller than the muscles of the ventricles, so the electric current accompanying the contraction of the atria will be small and is denoted in the electrocardiogram by the symbol (wave B) (P wave), while the contraction of the ventricles is denoted by the symbol (QRS group) (QRS complex), and then the diastole of the ventricles is denoted by the symbol ( wave T) T wave , Since the cardiac cycle begins with the contraction of the atria, then their diastole, then the contraction of the ventricles and then their diastole, and all this is recorded as waves in the electrocardiogram sheet...
In order of events:
* Atrial systole (wave B) (P wave )- then their diastole (- ) and here atrial diastole is not recorded because it occurs at the same time as ventricular systole and therefore ventricular systole hinders the recording of atrial diastole.
* Contraction of the ventricles (QRS group) (QRS complex) - and then their diastole ( wave TT wave).
• For the ( QRS) group, the first curve down the straight line is called (Q wave) (Qwave) and the next curve up is called (R wave) R wave) (it can be preceded by (Q wave) or not, then followed by another curve down called (S wave) (S wave) and it is also possible to be preceded by a Q wave or not ... That is, it is not a requirement that the systole of the ventricles be represented by the whole QRS group .
* And any change in these images reveals a problem that may be in the heart rate or the result of an artery blockage or something else, but the most used and most obvious images are (lead II) and (avR) and one of them is used to follow the patient's condition in intensive care units, and if the most used is ((lead II
Shape (6)
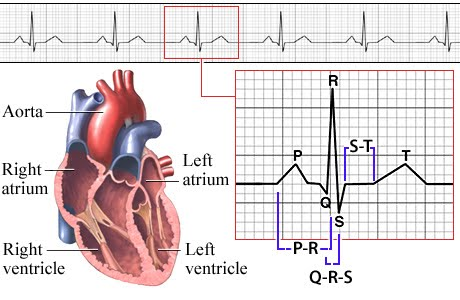
• There are 10 electrodes (cameras) - electrodes-placed on the chest, legs and arms .... They result in 12 images (leads) and are as follows:
• (Lead I, lead II, lead III, aVR, aVL , aVF, V1,V2,V3,V4,V5,V6).
An important rule
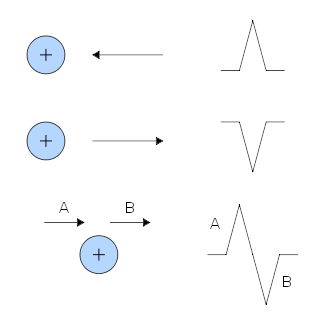
• If the direction of the electric current in the heart is in the same direction as the electrode (camera) directed, then the result is a negative curvature (down) on the ECG sheet, and vice versa, if the direction of the current is opposite to the direction of the camera, the result is a positive curvature (up) on the ECG sheet, and if the direction of the current has nothing to do with the direction of the camera, then the signal
(Bending) has any shape.
* Therefore, we find that most of the curves of (lead II) are positive (up ) because the pole ( camera) is directed against the direction of the current, and the curves of (avR) are not down because the camera is directed in the direction of the current.
To read an electrocardiogram, you must follow the following :
1. Heart rate / minute.
2. The rhythm of the heart rate (regular or not).
3. Cardiac axis dysfunction.
4. Signs of ischemia( ischemia).
5. Wave B (P wave ).
6. Distance B – R ).P-R interval(
7. Group QRS (QRS complex).
8. Wave TT wave ().
9. Part s-t ( )ST segment
Shape (7)
Heart rate and rhythm
* The electrocardiograph captures electrical currents and records them on graph paper with equal-sized squares at a regular rate, where the electrocardiogram paper contains large squares and each large square contains 25 small squares (5×5) and each small square (1 mm) represents 0.04 seconds, and therefore each large square (5 mm) represents 0.2 seconds, that is, 5 large squares represent (1 second) and 300 large squares represent (1 minute), and from that
• We can calculate the heart rate per minute, for example, if we find a complete heart cycle that repeats every large square, that is, the heart beats at a rate of 300 beats / minute, and so on
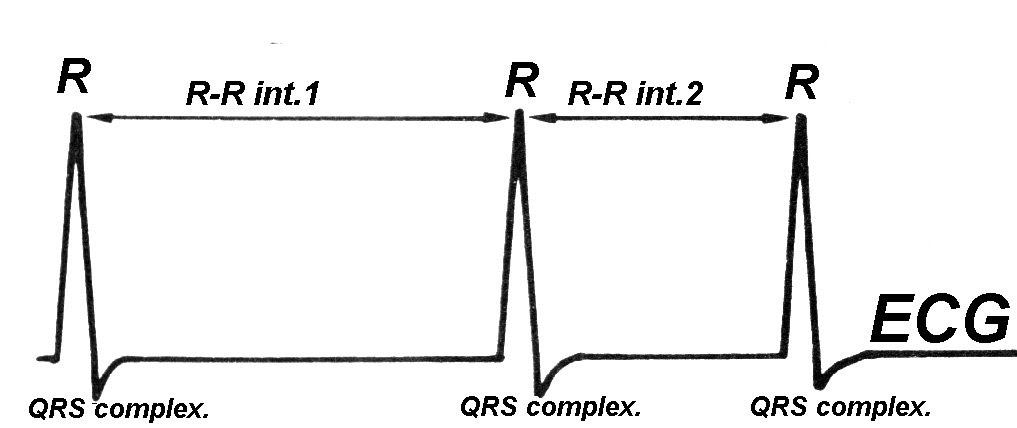
* Measuring the distance between (R waves) (R waves) and some of them _ considering that it is the highest point in the drawing _ represents the heart rate the distance between (r_r) (interval R-R) represents the time it took to conduct electrical currents through the different parts of the heart
Heart rate can be measured as follows:
* Heart rate =300 (300 squares to calculate the number of heartbeats per minute)÷ the distance between ( R-R), but this is if the heart rate is in a regular rhythm....
* The rhythm measurement is done by matching the distance between (R - R) be equal in all images،
• If the rhythm is irregular, we will calculate the heart rate as follows:
* Irregular electrocardiogram
Shape (8)
* Heart rate= number (RR waves ) .
• Within 6 seconds × 10 .
This calculation is performed along the ECG images for 6 seconds.
• - P wave wave B:
* Period: it represents the period of contraction of the atria .
* Duration: equal to 0.08_0.12 seconds, i.e. (2-3) small square, and sometimes it is said to be (2.5× 2.5 ) small square length in width.
Cases that can be diagnosed from the differences that occur in (P wave ):
1-the large size of the right atrium: the causes of pulmonary hypertension
It is diagnosed from an increase in the height (length) of wave (B) more than 3 mm as a result of an increase in the period of contraction of the right atrium due to its large size, because one of the most famous causes of high pulmonary pressure(Pulmonary hypertension), it is called (P wave) as (P-Palmonale).
2-the large size of the left atrium: the causes of mitral stenosis (mitral stenosis
And it is diagnosed from an increase in the width of wave (B) more than (0.11 seconds) as a result of an increase in the period of contraction of the left atrium due to its large size, because one of the most famous causes of mitral stenosis is called
• (P wave) (P-Mitral).
• (P- R interval):
* It starts from the beginning (wave B) to the beginning (QRS group), i.e. from beginning to beginning, and it represents the time it takes for the electric current to travel from the atrial sinus node to the atria and from it to the ventricles.
And it is equal to = 0.12-0.20 seconds, that is, from (3-5 ) small squares.
QRS group (QRS complex)
* Period: represents the time it takes for the current to travel through the ventricles.
* Duration: equals = 0.12 seconds (3 small squares).
* Diagnosis: as mentioned, it helps in the diagnosis of atrial and ventricular fibrillation, atrial flutter and types of heart rhythm disorders.
It also helps in the diagnosis of angina pectoris, stroke, as we will explain, and other heart diseases.
* An imaginary line drawn on the heart represents the result of the electric current, as the direction of the electric current in the heart comes from the atrial sinus node - as we have indicated before – downwards, and as the left ventricle is larger than the right ventricle-because it feeds the whole body with blood-so if we imagine the path of the electric current in the heart will be A little to the left....This is what is called the axis of the heart.
* Any changes in this axis are called the imbalance of the heart axis to the right or left
• ( Rt or Lt axial deviation)
Sixth: QT distance (QT interval)
* It starts from the beginning (group QRS ) to the end (wave t ) and represents the time it takes for the ventricles to contract and diastole .
And it is equal to = 0.30-0.44 seconds, which is less than two large squares and a small square.
This distance is increased due to antiarrhythmic drugs (antiarrhythmic drugs) that block potassium channels
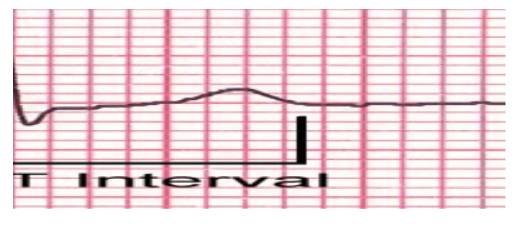
Seventh: wave T (T wave
Period: represents the period of diastole of the ventricles.
Duration: 4 small squares represent a height.
Shape: very similar to wave B, but wave T is asymmetric and takes the shape of the letter T and is in a modified position in the picture (lead II) and inverted in (aVR
Diagnosis of some differences due to changes in the (T-wave):
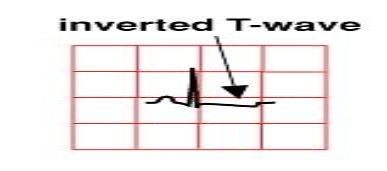
The (T-wave) is low or flat in cases of :
Lack of potassium in the blood (hypokalemia) and pericardial effusion (pericardial effusion).
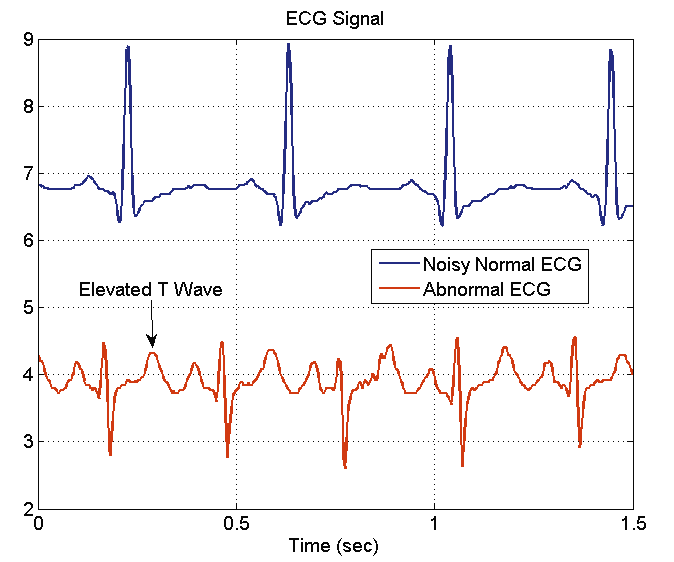
The (T-wave) is high in cases of
* Increased potassium in the blood ( hyperkalemia) and inflammation of the pericardial membrane lining the heart muscle (pericarditis)
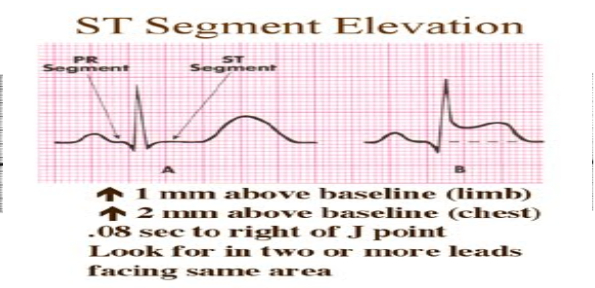
VIII: part s _ t ( ST segment) and signs of anemia (ischemia):
* It starts from the end (group QRS) to the beginning (wave t) and it represents the time when the ventricles are contracting
• And it is equal to = 0.08 - 0.12 any of the (2-3) small squares.
Angina pectoris (Angina):
Among the most important distances that diagnose many cases are the most important :
* The distance (a_t) is lower than its normal level by 1 mm, and with it also (wave T) is lower than its level ... This is in addition to the presence of some types of cardiac arrhythmias

For myocardial infarction of the heart (myocardial infarction of the clot or the distance (a_st) is 1 mm higher than its normal level and also has a (wave t ) higher than its level ... This is in addition
to the presence of some types of cardiac arrhythmias
It was located in :
* lead I, aVL)) so this is a lateral infarction ( lateral infarction).
* II, III, aVF)) so this is a lower infarction (inferior infarction).
• V1-6)) so this is an anterior infarction ( anterior infarction).
And if the clot is old, it is characterized by the fact that the Q wave (Q wave) is deeper than its level by 4 mm and 0.04 seconds wide, and this is important for diagnosing an old clot.
Types of cardiac arrhythmias
* Arrhythmia of the heart (sinoatrial node):
Slow heartbeat
Definition: slow heartbeat is when the heartbeat is less than 60 beats per minute and less .
Their causes: digitalis poisoning – heart stroke – vomiting .
Symptoms: fainting :
Treatment: administration of atropine .
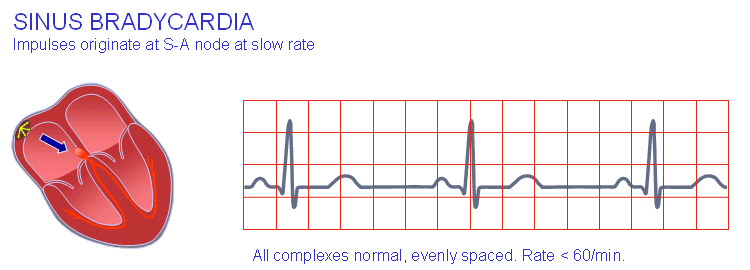
Form (9) slow heartbeat
2-rapid heartbeat :
Definition: rapid heartbeat is when the heartbeat is more than 100 beats per minute .
Its causes : high fever – heart failure-anxiety-exercise .
Symptoms: low blood pressure-palpitations .
Treatment: a drug that reduces arrhythmia (indral-cordarone-isopten ).
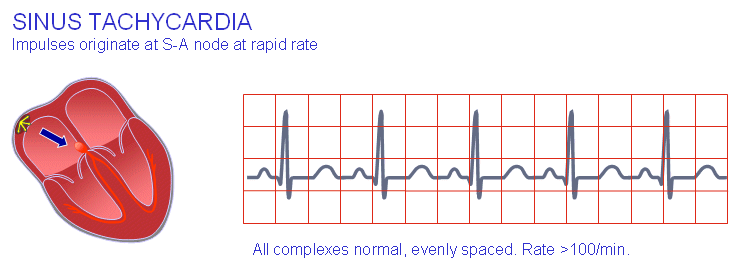
Form (10) rapid heartbeat
Cardiac arrest :
Definition: the non – appearance of the B-R wave
Their causes: digitalis poisoning .
Treatment: medication that reduces arrhythmia
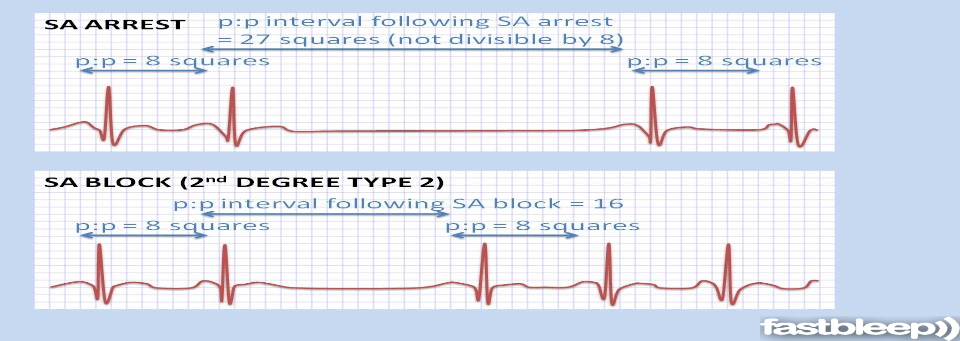
Form (11 )
Arrhythmia of the heart (atrial ):
1-incomplete constriction of the atrium
Definition: electrical charges are emitted before the normal contraction of the atrium .
Its causes : coffee anxiety - low potassium content .
Treatment :the cause is treated
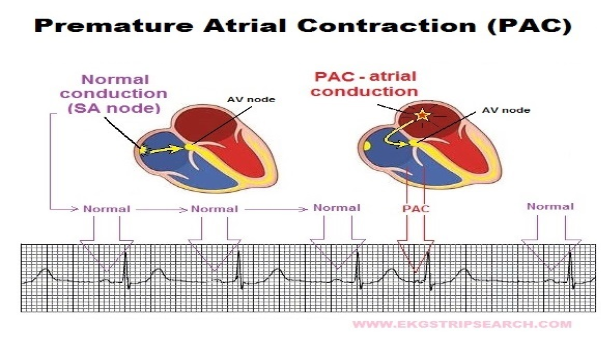
2-irregular atrial contraction
Definition: irregular atrial contraction contracts about four times in a row atrial beat rate 250-350 ventricular beat rate 60-100
Its causes: heart disease (heart stroke ) .
Symptoms : palpitations
Treatment :the cause is treated
Form (13)
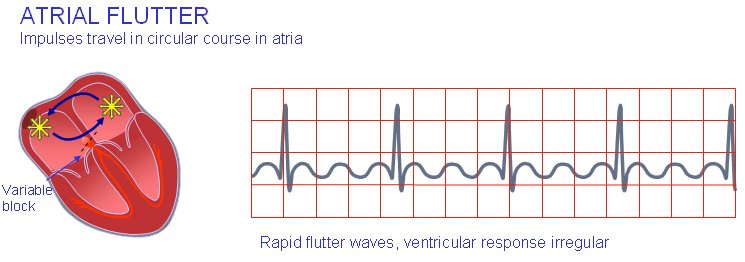
3-atrial flutter
Definition: non-emission of the electrical signal from the sinoatrial nodes cap rate is higher than 350-600 beats per minute .
Its causes: heart disease (heart stroke ) .
Treatment: cordarone-electroshock device

Form (14)
Arrhythmia of the heart (ventricular ):
1 - incomplete contraction of the ventricle
Definition: electrical charges are emitted before the normal contraction of the ventricle wave B may be absent or be inverted and then followed by incomplete contraction of the ventricle
Causes :lack or excess of potassium .
Symptoms : palpitations
Treatment :the cause is treated

Form (15)
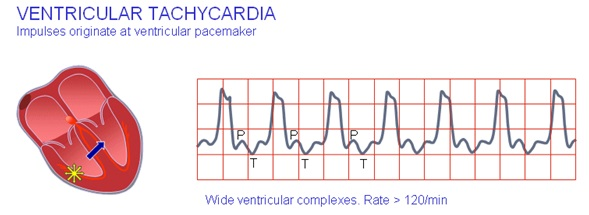
2-rapid ventricular beats
Definition: heart rate is more than 100 -140-240 characterized by cardiac arrhythmias
Its causes: imbalance of body fluids – lack of oxygen in the blood .
Treatment :the cause is treated
Shape (16)
3-ventricular flutter
Its causes :a heart clot –hypothermia.
Symptoms: loss of consciousness-changes in vital signs
Treatment :the cause is treated

Shape (17)
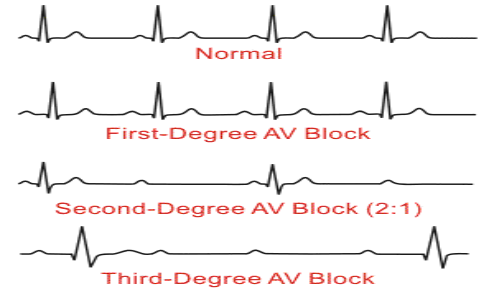
(Cardiac arrest ) :Heart block
First degree of cardiac arrest: the usual length of the distance increases.
The second degree: the length of the distance gradually increases, followed by the absence of (QRS group), then it returns to normal again, and so on.
Third degree: the QRS group overlaps with (wave B) and the QRS group exists in different forms
Shape (18)
